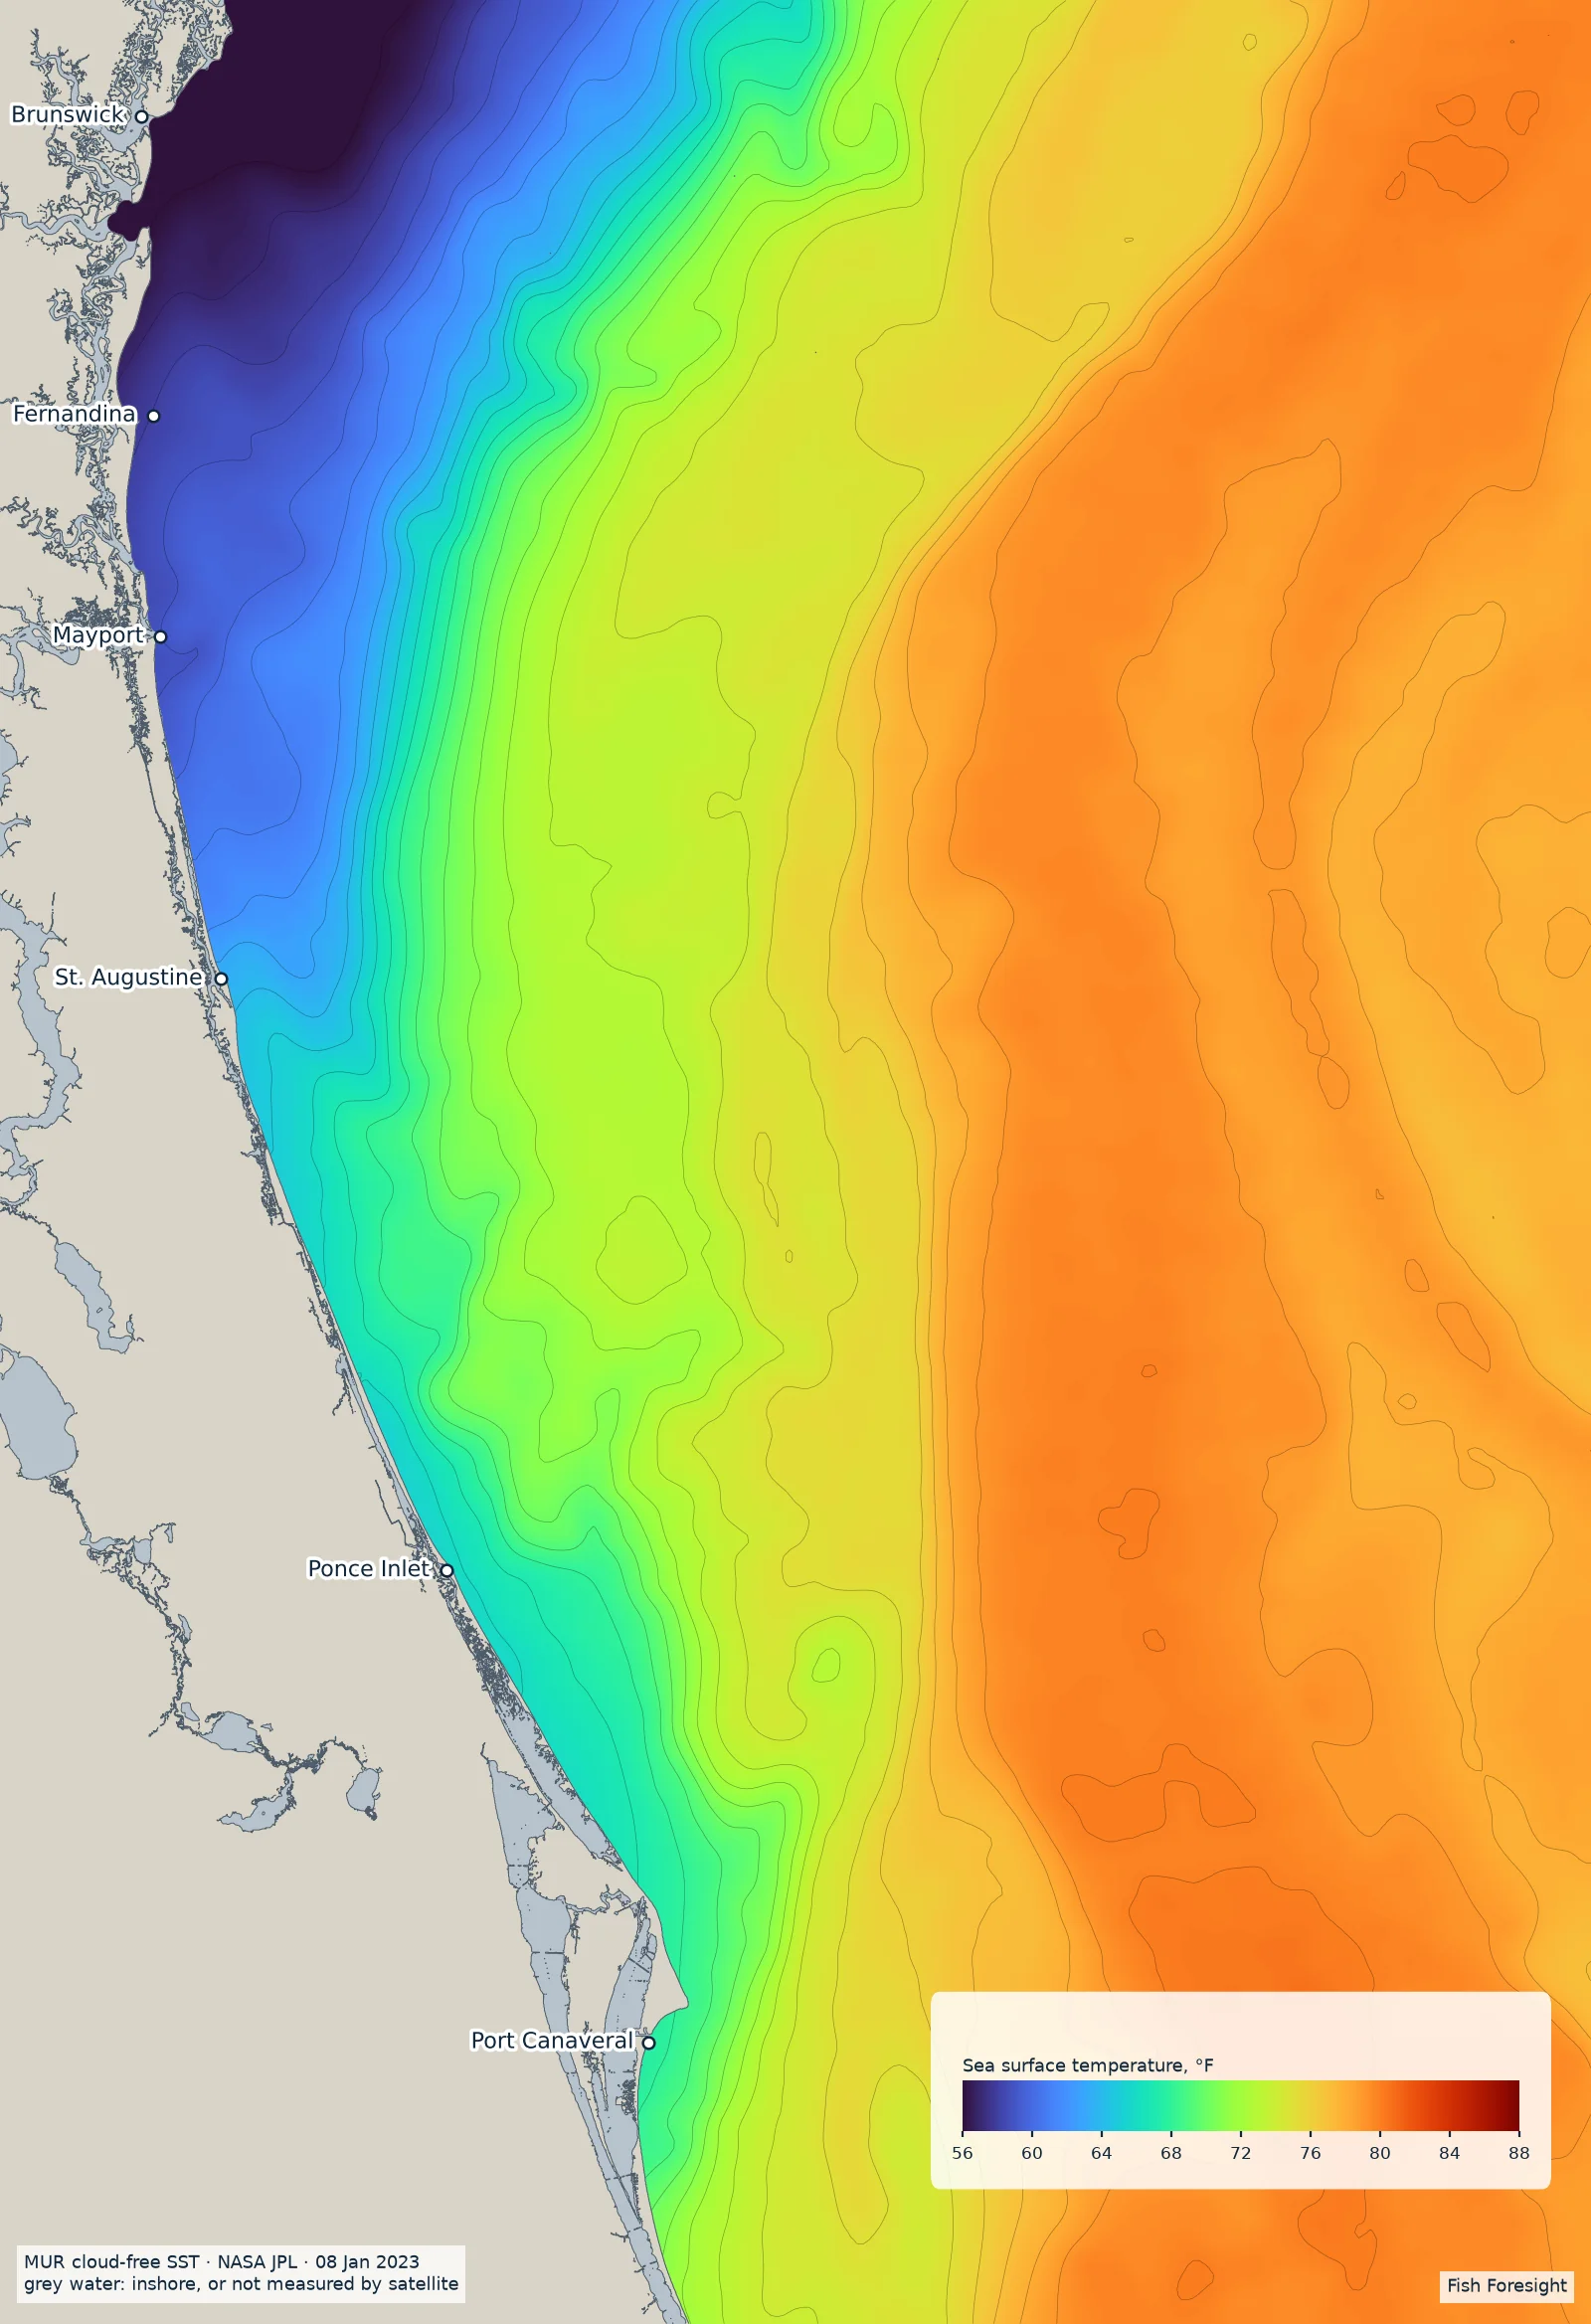
Sea surface temperature
Cloud-free daily temperature at 1 km, with 1 °F contours drawn in.
°F Fish Foresight
Satellite ocean data for offshore anglers
Cloud-free sea temperature, temperature breaks, water color and depth, every day. Then an opportunity score that puts the layers together for the fish you're after, so the morning plan takes minutes instead of an hour of flipping charts.
Launching with wahoo · Northeast Florida · more species and regions to follow
Read the water
Every map opens on the same color scale every day, so a color always means the same temperature, clarity or depth, and a change on the map is a change in the water. Custom scales for more contrast on a given day are planned.
Cloud-free daily temperature at 1 km, with 1 °F contours drawn in.
°F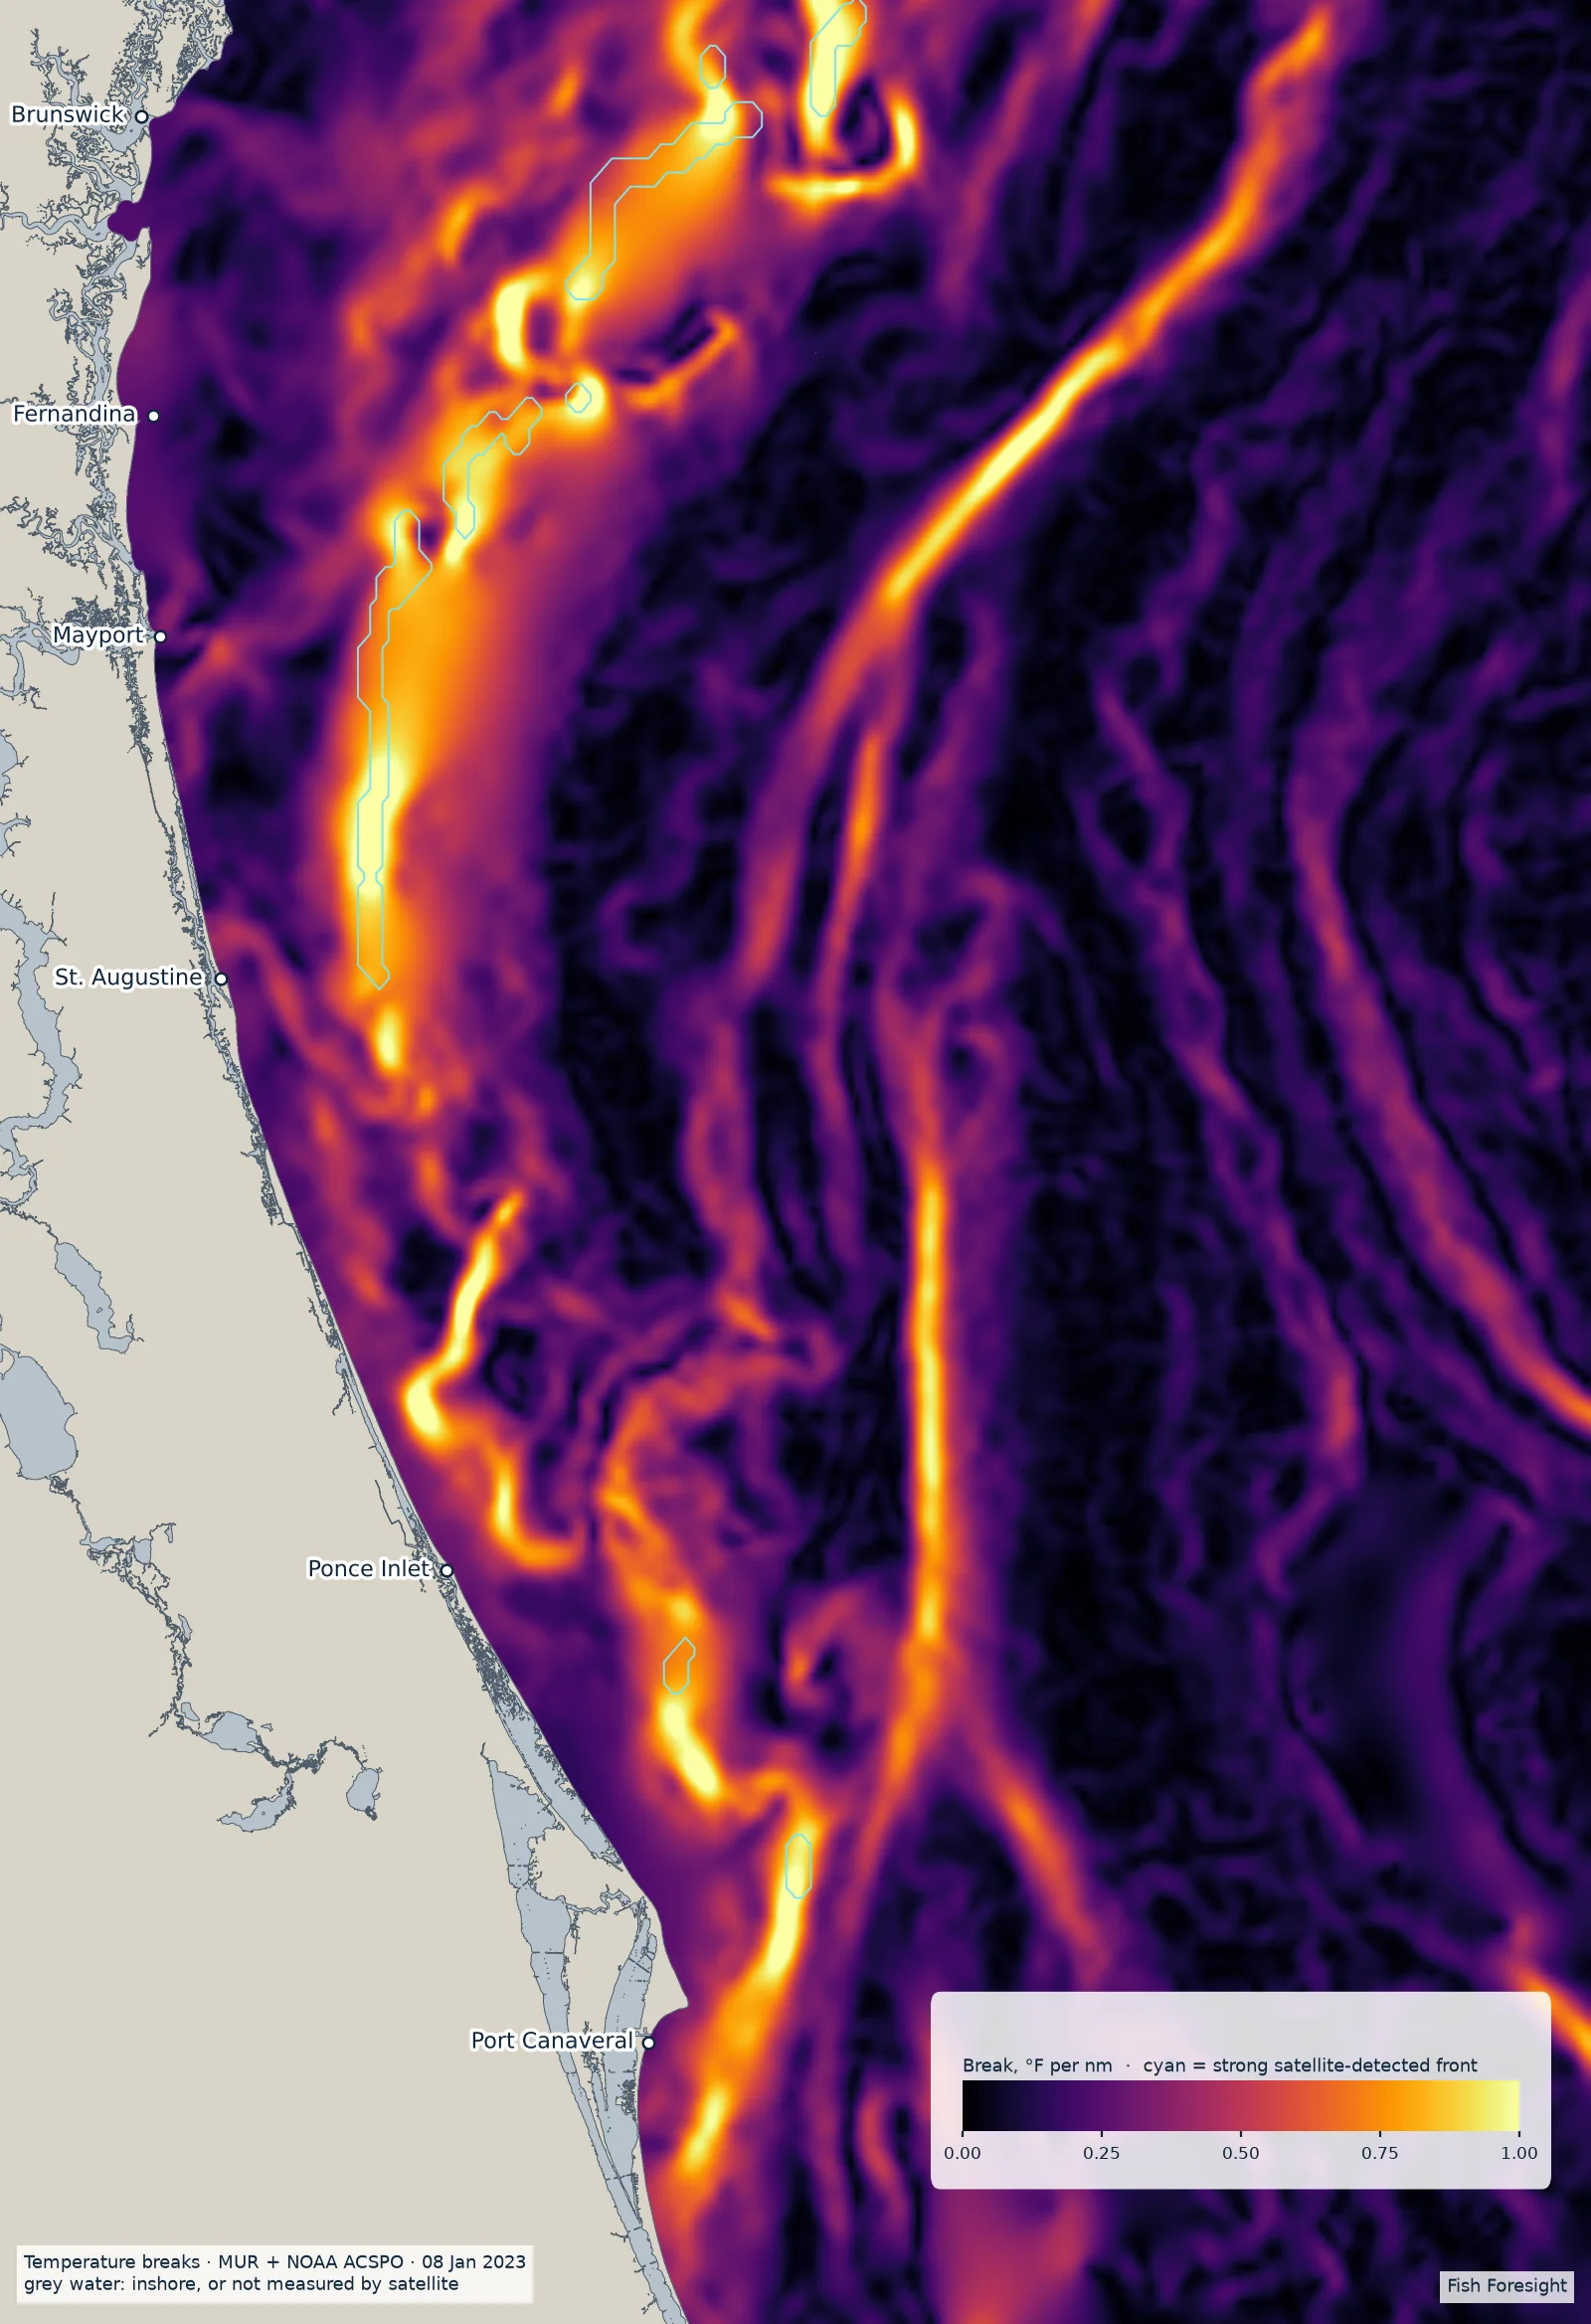
How sharp the temperature change is, mile by mile, with the fronts satellites actually detected marked on top.
°F per nautical mile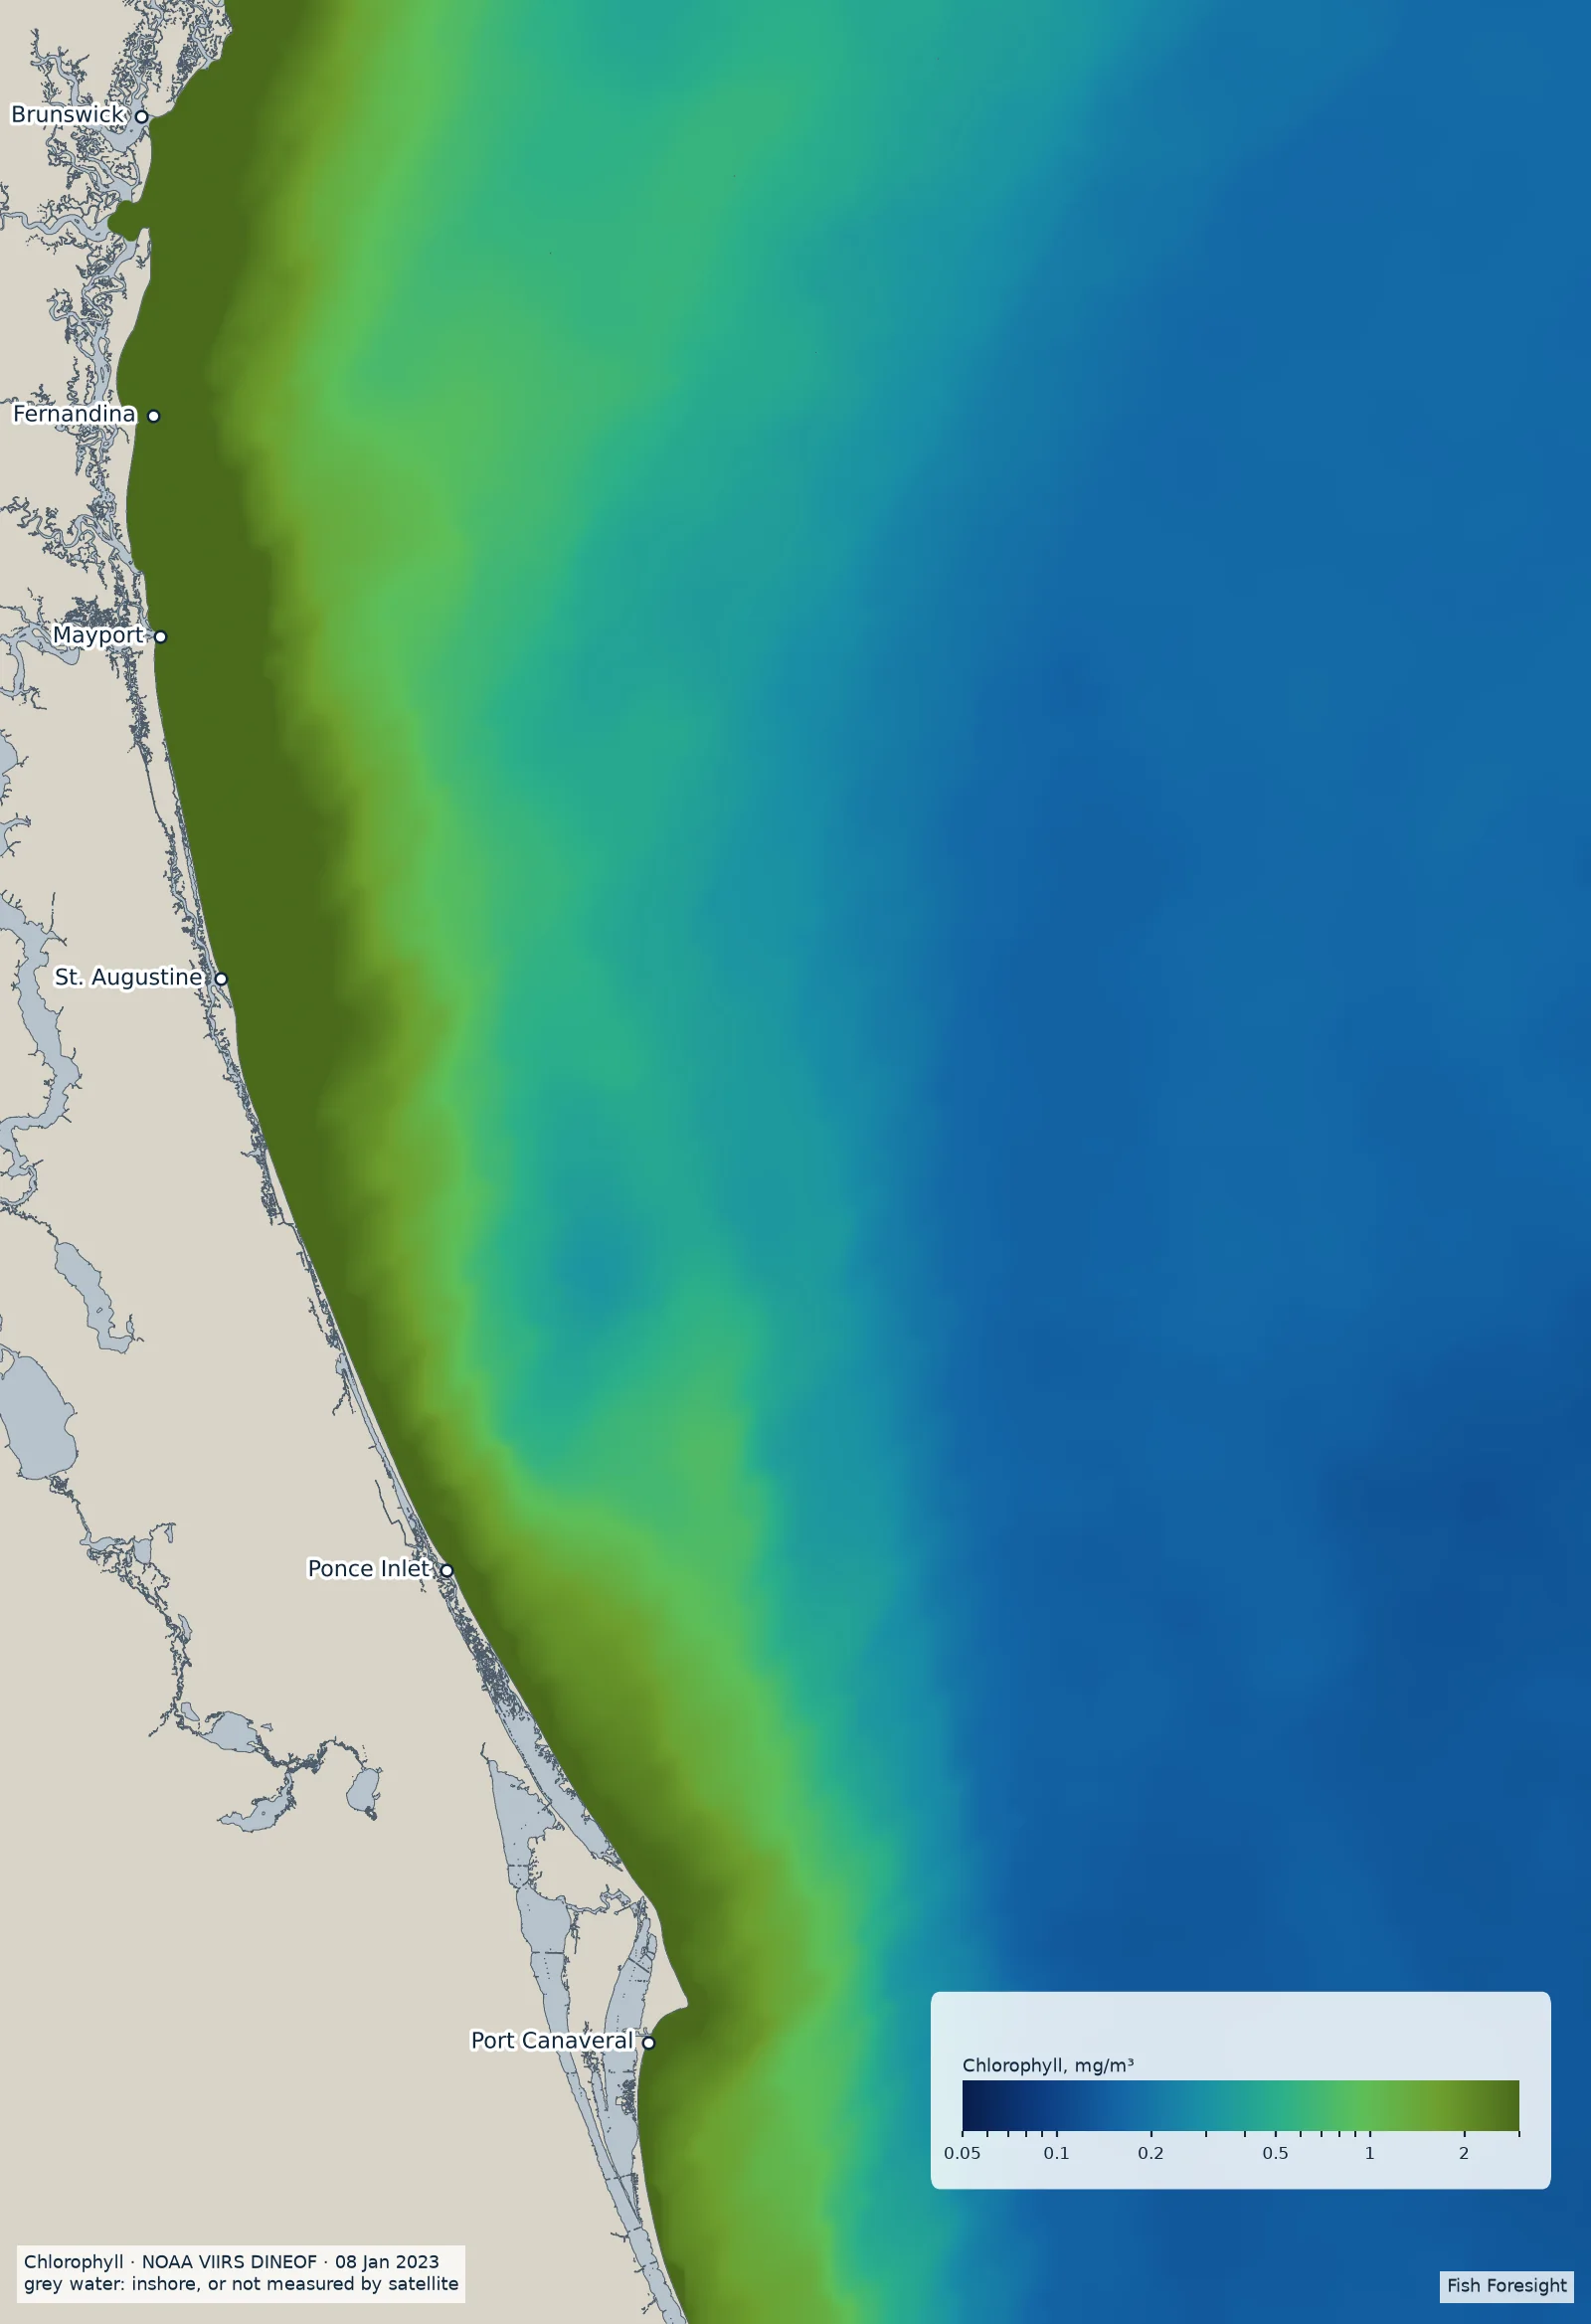
Where blue water meets green. Color edges hold bait, and the clean side is where you want to be.
mg/m³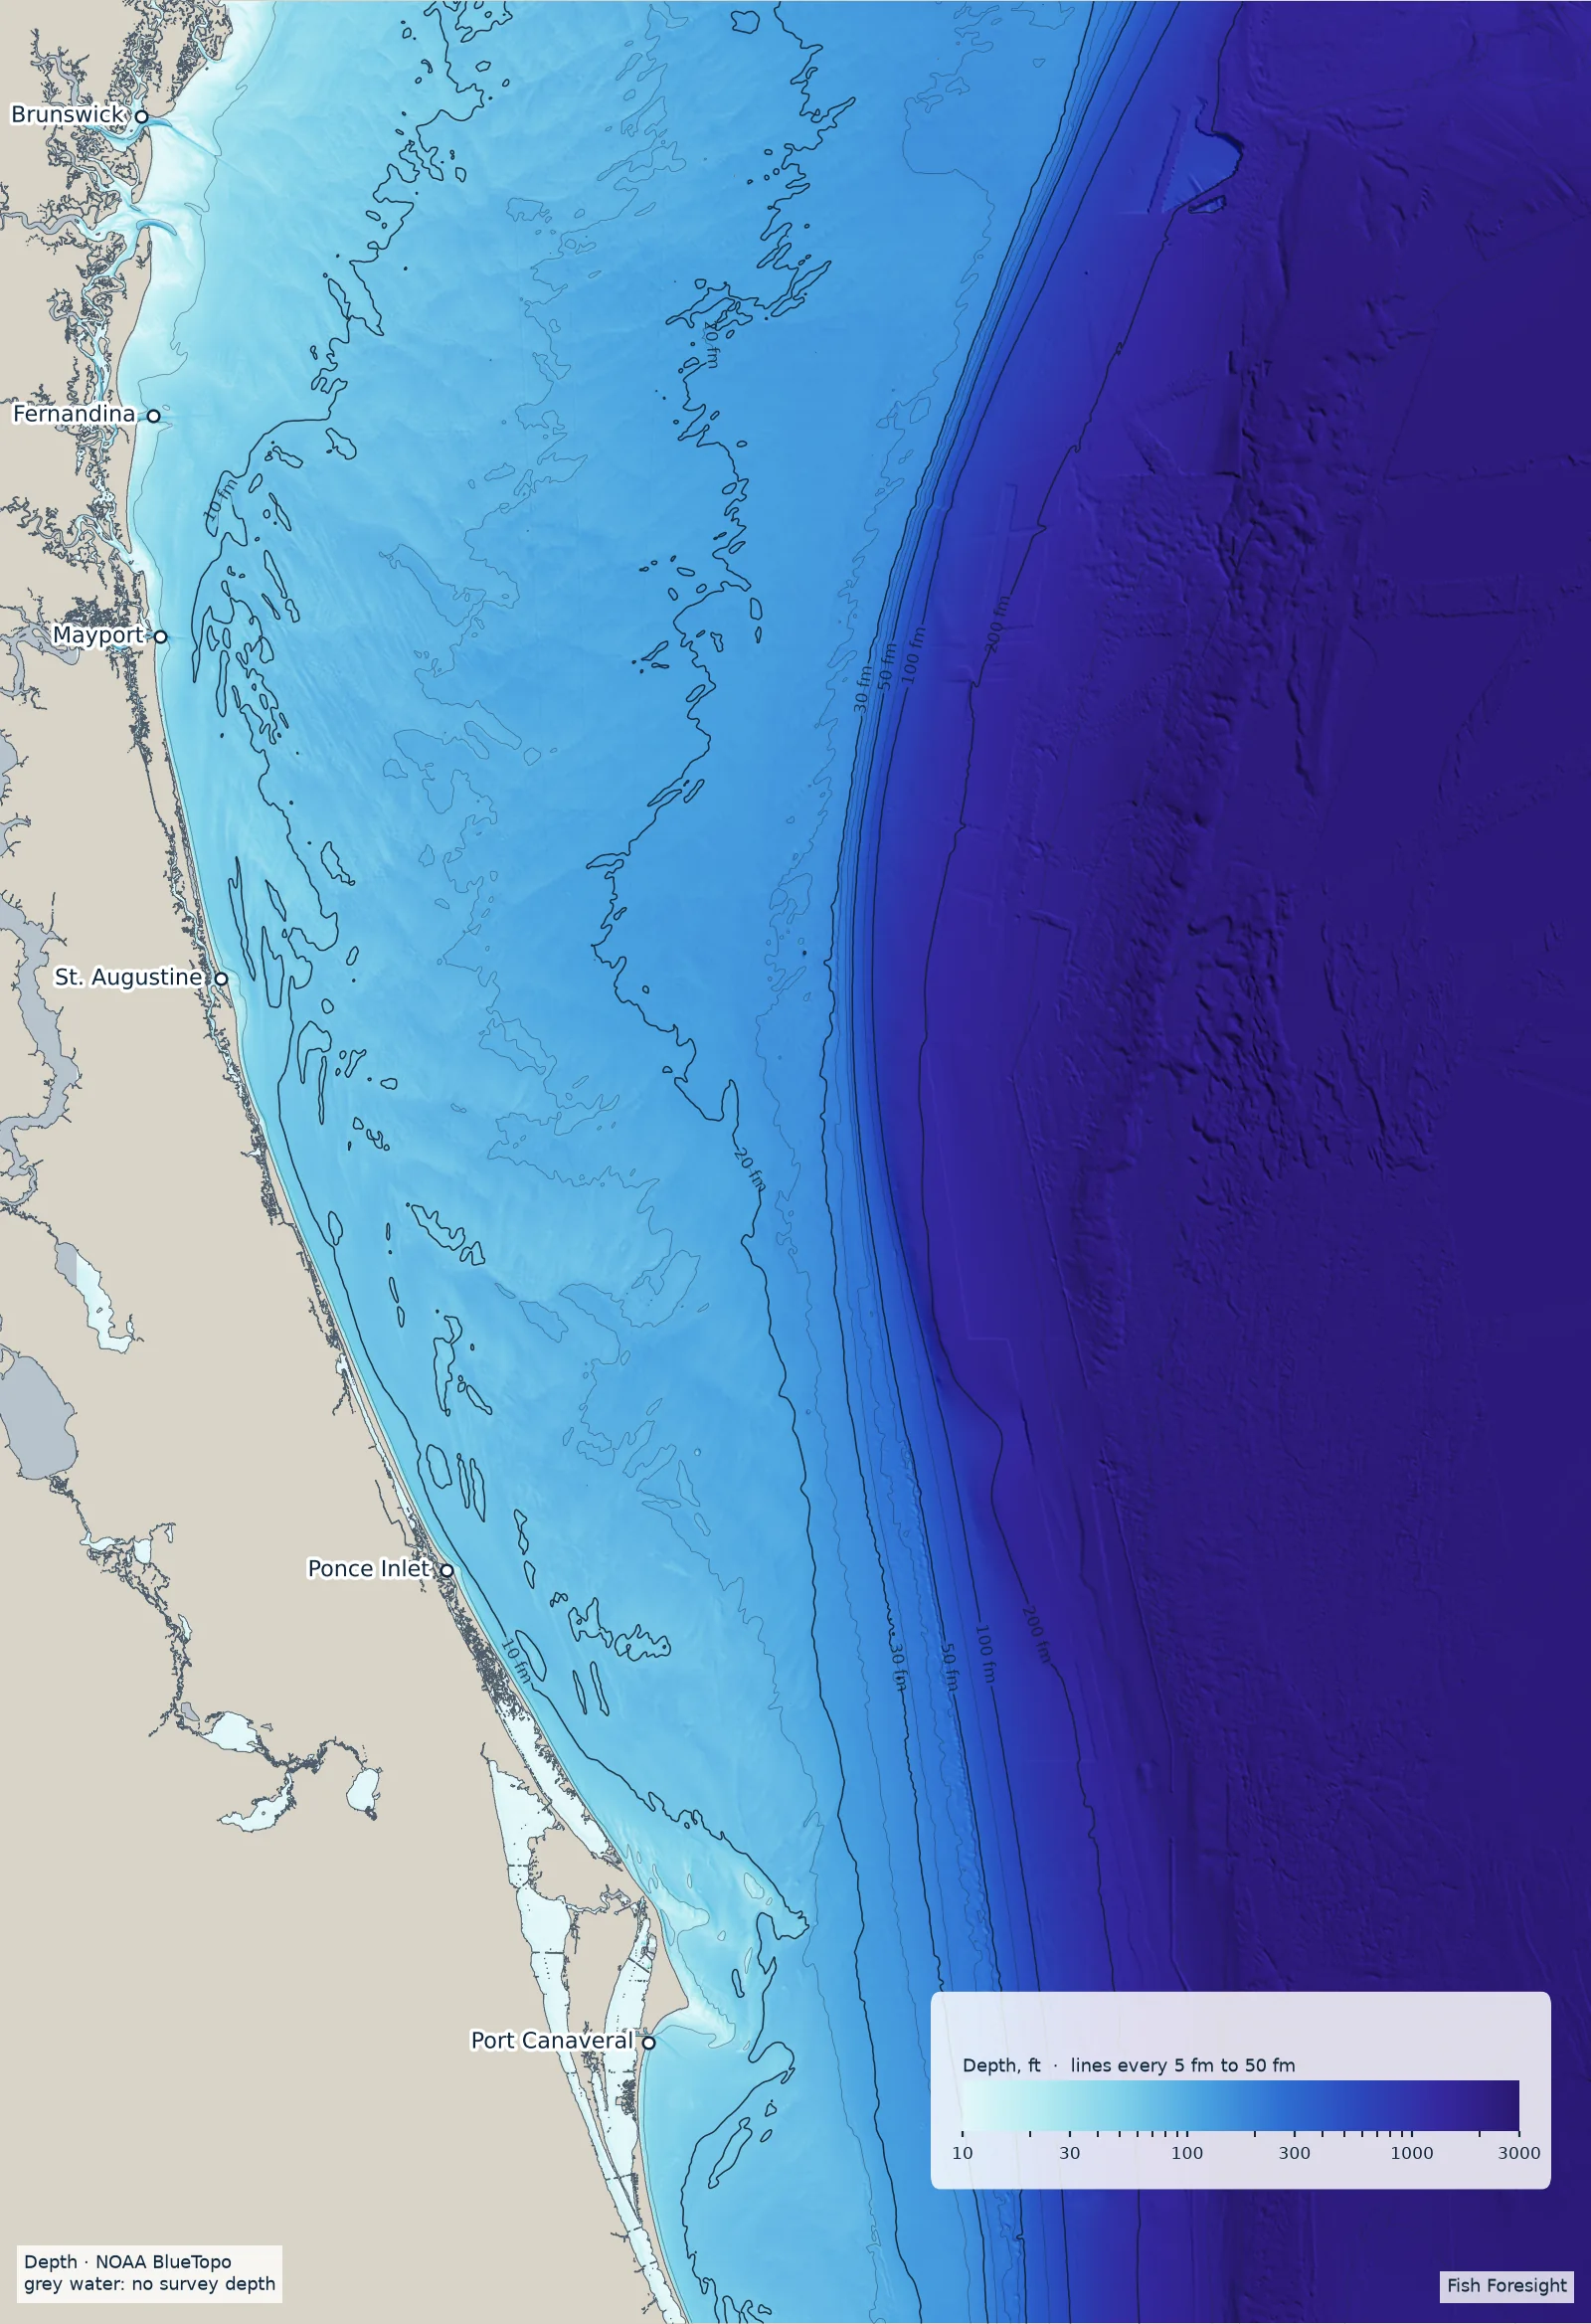
NOAA's high-resolution depth survey, with the ledges and curves offshore anglers run to.
feet · fathomsEddy edges and the wall of the Gulf Stream from sea-surface height, where moving water piles bait against a line.
knots · cm of sea-surface height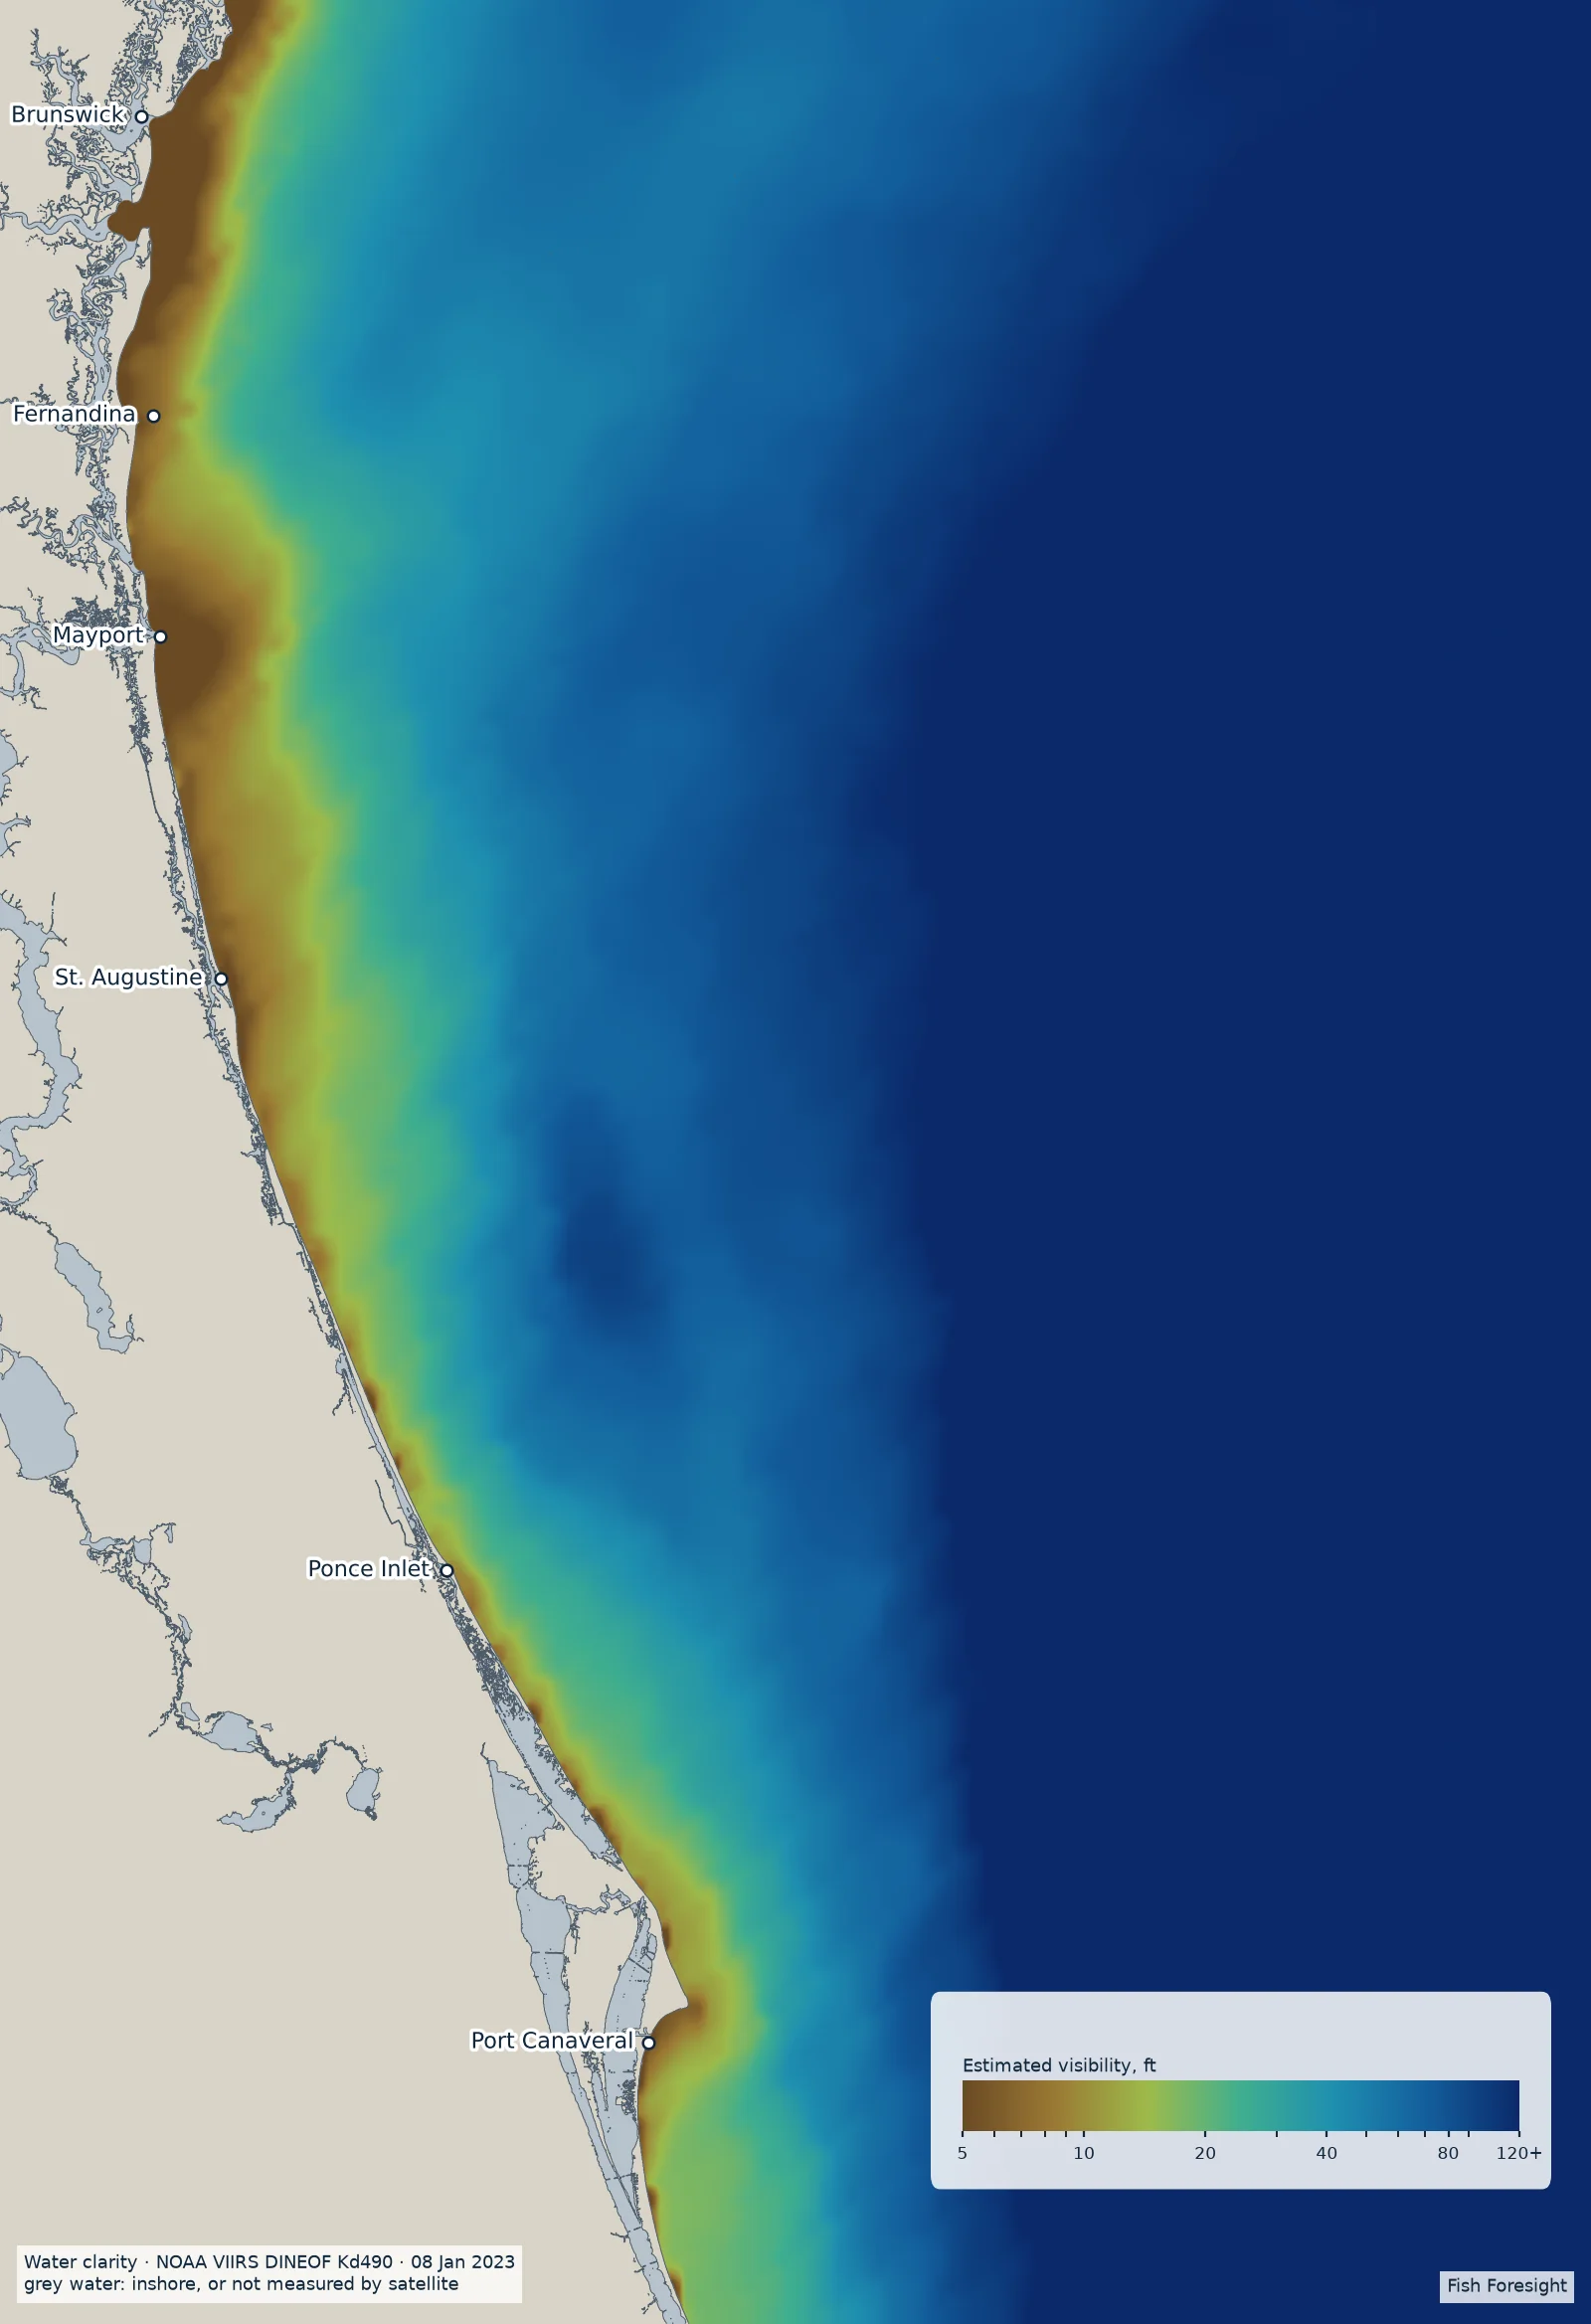
How far you could see down, estimated from how fast light fades in the water. Turbid water shows up before you run to it.
estimated visibility in feetBeyond imagery
Imagery shows you the water. The score says whether that water supports the fish you're targeting, today, at depths you can fish.
Species & regions
Wahoo off Northeast Florida is the first species and region because that's where the score is being tested against real catches. Each new species and region follows once it has passed the same tests.
Tell us where you fish when you join the list. That's how the next regions get picked.
Planned for phone and web
Save waypoints and see every layer and the score at each one, side by side.
Log a fish and the water conditions at that spot are saved with it automatically.
Numbered starting points for anglers still learning an area, built from the water and the bottom.
Wind and seas alongside the water, so the go/no-go call is in one place.
Where it stands
The model is built and scores the whole region every day it runs. Before launch it will be checked, under rules written down in advance, against expert offshore reports and logged catches from days it has never seen.
Expect straight answers. In September off Northeast Florida the wahoo map is mostly empty, because the water doesn't support targeting them. On those days a blank map is the right answer.
“Follow me, and I will make you fishers of men.”Matthew 4:19
Beta list
One email when it's ready to try, plus the occasional note about the beta if you join it. No selling or sharing your address.